Exploring spatial and biodiversity data#
Summary
This walkthrough provides a complete data processing example from start to finish. We demonstrate how to combine spatial and biodiversity data in a practical example.
The example is based on two data sources:
Biodiversity data from Lebendiger Atlas der Natur Deutschlands (LAND): Species observations as coordinate-based vector data.
Spatial data from IOER Monitor: Aggregated and processed land use data that is provided in raster format (WCS).
Lebendiger Atlas der Natur Deutschlands (LAND)#
LAND - Lebendiger Atlas der Natur Deutschlands compiles species observation data in Germany. It displays selected occurrence datasets that are publicly available through the Global Biodiversity Information Facility (GBIF). GBIF aims to provide open access to biodiversity data worldwide. This connection enables users to explore Germany’s biodiversity data via LAND while also accessing and utilizing selected datasets from GBIF’s global database.
There are two ways to find and download data:
Via web browser: Search, explore and download individual data files directly from LAND using its occurrence search, geo viewer, and download options.
Via code: Use the GBIF Application Programming Interface (API) Reference to access data programmatically.
For both methods, and especially for larger downloads, registration is required.

IOER Monitor of Settlement and Open Space Development (IOER Monitor)#
The IOER Monitor of Settlement and Open Space Development (short IOER Monitor) is a research data infrastructure provided by the Leibniz Institute of Ecological Urban and Regional Development (IOER). It offers insights into land use structure, development, and landscape quality in Germany. Indicators and data can be explored and visualized in an interactive geo viewer. All IOER Monitor data is available through Web Feature Service (WFS) and Web Coverage Service (WCS), allowing users to retrieve spatial data in standardized formats.
There are two ways to access and download data:
Via web browser: Login, search and download individual data files directly from the IOER Monitor’s download services.
Via code: Use the Monitor API to access data programmatically.
In both cases, registration is required.
Using the Monitor API
If you want to use the Monitor API, you need to register:
Register at monitor.ioer.de/monitor_api/signup.
Generate a personal API key in your account settings.
Store your personal API key in a file called
.envasAPI_KEY=xyz
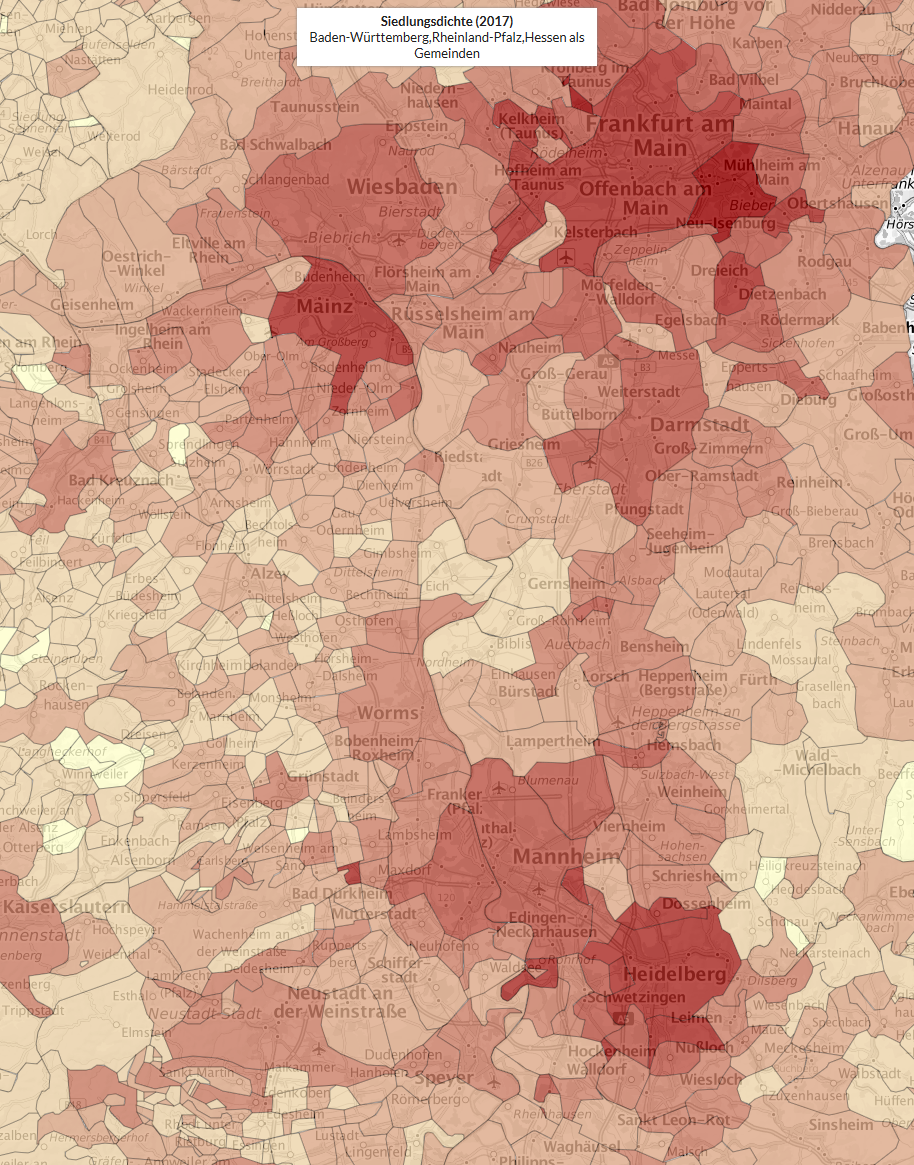
Fig. 4 Wie dicht leben wir? IOER Monitor data.#
Example research question#
In the next section, we demonstrate how to combine spatial and biodiversity data in a practical example.
Specifically, we will investigate whether there is a positive correlation between Passer domesticus (common name: House Sparrow, English Sparrow) density and settlement areas. Since house sparrows are known to prefer urban environments, this pattern should be visible using data from the IOER Monitor and LAND data.
Additionally, we will examine population trends for house sparrows in Saxony. According to Šálek, Riegert, and Grill (2015), an overall decline in house sparrow populations has been observed:
Populations of House and Tree Sparrows have rapidly declined in various breeding habitats throughout their European distribution range; however, the strongest decline was recorded within urban environments. (Šálek et al. 2015)
But is this also true for Saxony? Let’s explore whether the data supports this trend…
Summary
While Python offers multiple ways to process data, we will focus on a single approach without exploring alternative routes. Where further details are useful, cross-references to the reference documentation (Part III) or external sources are provided.
References#
Martin Šálek, Jan Riegert, and Stanislav Grill. House Sparrows Passer domesticus and Tree Sparrows Passer montanus : Fine-Scale Distribution, Population Densities, and Habitat Selection in a Central European city. Acta Ornithologica, 50(2):221–232, December 2015. doi:10.3161/00016454AO2015.50.2.010.